Spinning the strand
Loading
Spinning the strand
Loading
—
Exploratory analysis of Food-101, run before a single model was trained. Six questions, each of which changed a decision — and one that predicted where the finished model would fail.
101,000
images scanned
every file, not a sample
1.0000
imbalance ratio
perfectly balanced
0.09%
near-duplicates
above cosine 0.999
4 / 5
failures predicted
before any training
The first question for any classifier, because the answer decides whether accuracy is an honest headline or a misleading one.
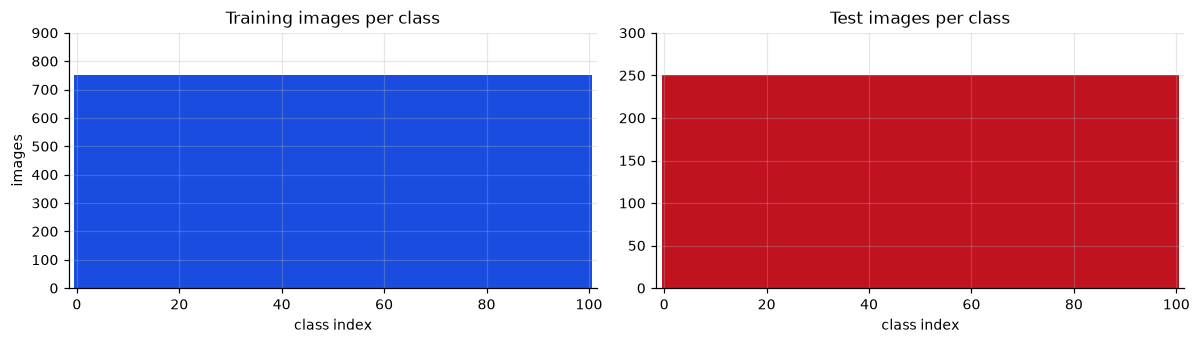
Counting the files gives exactly 750 training and 250 test images for every one of the 101 classes. Imbalance ratio 1.0000; standard deviation of class counts, zero.
What it changed
No resampling, undersampling, SMOTE or class weighting. Plain accuracy is honest. Macro- and weighted-averaged metrics must come out identical — which they do, to three decimals, and that is a free correctness check on the evaluation code.
Photographs from many different people are not a uniform size, and the resize strategy has to be chosen against the real distribution.
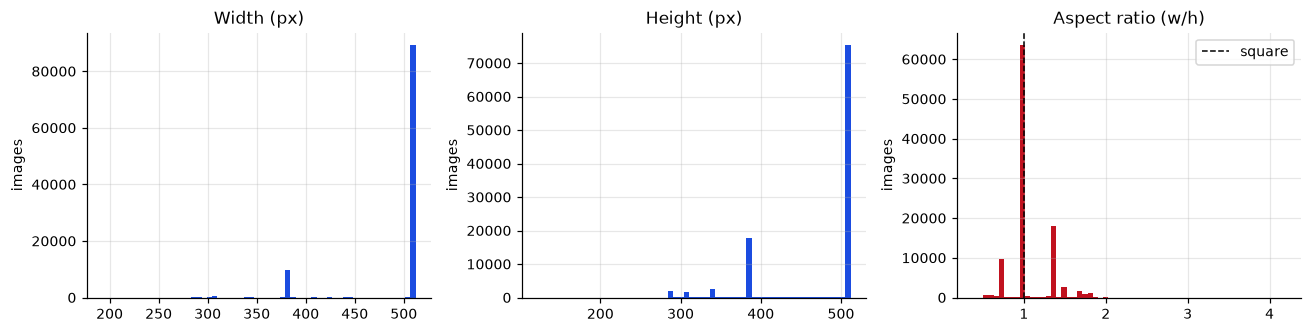
Every image has its longest side capped at exactly 512 px — 100% of files — confirming the authors rescaled the collection. There are 464 distinct width–height pairs. By shape: 61.6% square, 26.0% landscape, 12.5% portrait. All 101,000 exported files are RGB.
What it changed
Backbones need a fixed square input, so resize-then-crop is unavoidable, and on the 38.5% that are not square it will discard part of the frame. That is the argument for RandomResizedCrop: it turns an unavoidable loss into useful variation.
The backbones normalise with fixed ImageNet statistics, so it is worth knowing how far this dataset departs from them.
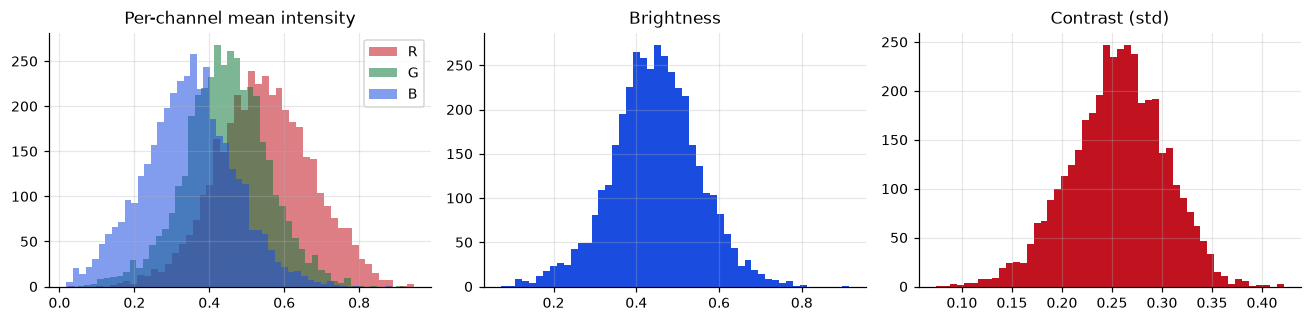
Food photography is markedly warm: mean red 0.547 against mean blue 0.345 — a gap of 0.20, where ImageNet's own channel means differ by less than 0.08. The poorly exposed tail is small: 3.83% below brightness 0.25, 0.33% above 0.75.
What it changed
color_jitter=0.3 is justified. The deployment case is a phone camera under unknown lighting, and the model should not come to depend on the white balance of restaurant photography.
If test images were near-copies of training images, the headline accuracy would be inflated and nobody would see it.
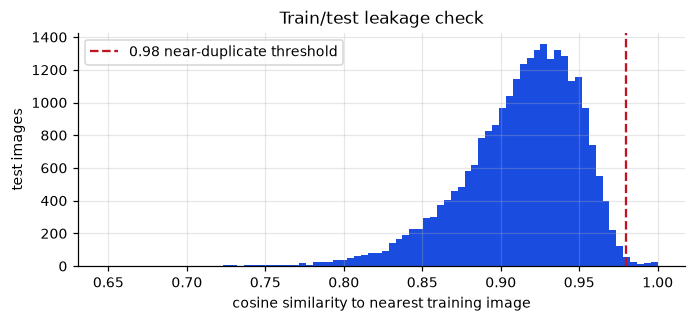
Using the cached SigLIP embeddings, the nearest training neighbour was found for all 25,250 test images. Only 22 (0.09%) exceed cosine 0.999, and 111 (0.44%) exceed 0.98. The distribution is centred well below 1.0.
What it changed
No de-duplication needed. The 13.96% above 0.95 is expected in user-uploaded restaurant photography — several people photograph the same dish — and is not leakage in the sense that matters.
The most useful result in the whole analysis, and the only one that made a prediction which could later be checked.
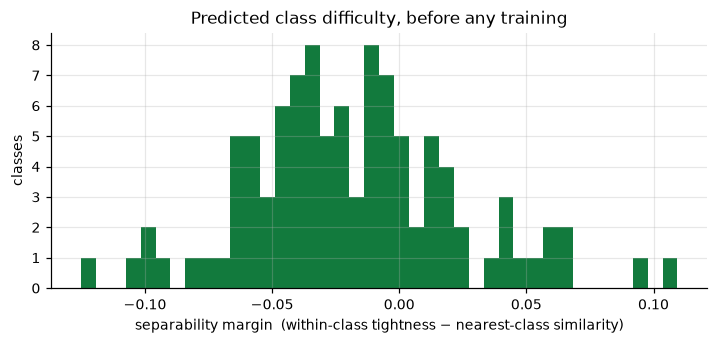
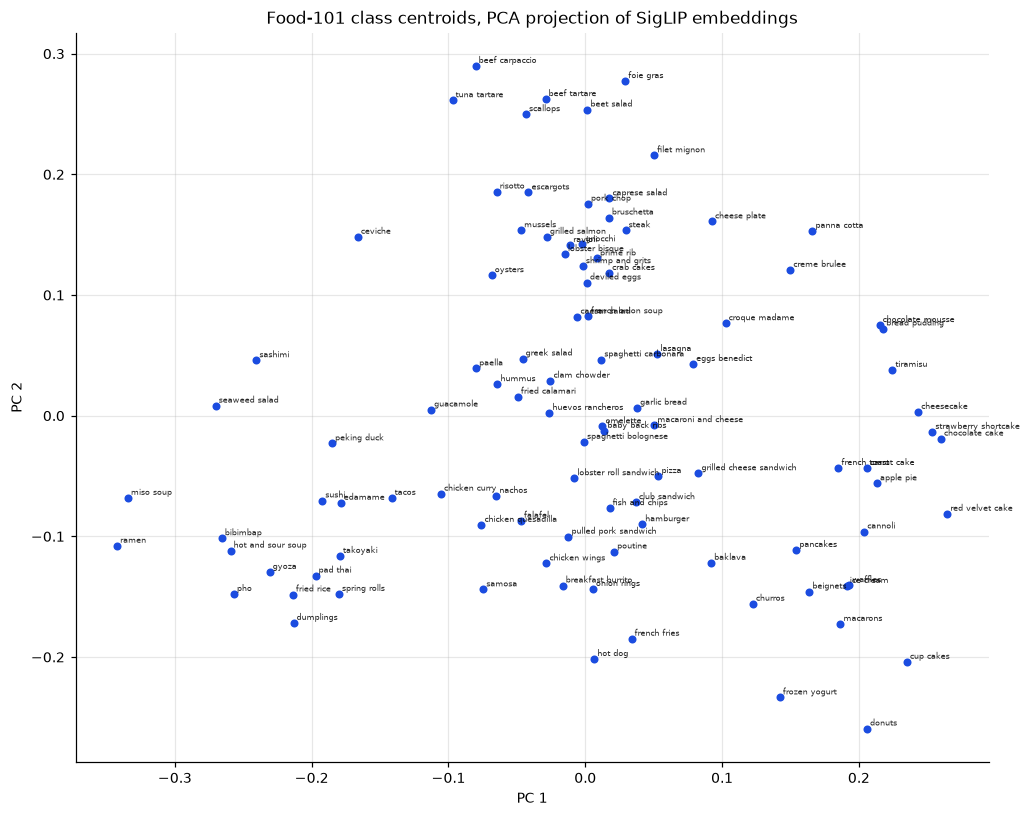
Each class centroid was computed in embedding space, then the cosine similarity between every pair. A margin — within-class tightness minus similarity to the nearest other class — ranks the classes by expected difficulty. No classifier is involved anywhere in this computation.
What it changed
The five smallest margins were steak, filet mignon, chocolate mousse, chocolate cake and pork chop. Four of those five turned out to be among the trained model's five worst classes.
The separability analysis was run before any classifier existed. Once the model was trained and evaluated on the sealed test split, the two lists could be compared. This table is the comparison.
| Predicted hardest | Nearest class | Margin | Actual rank | Accuracy |
|---|---|---|---|---|
| steak | filet mignon | −0.125 | 1st worst | 78.4% |
| filet mignon | steak | −0.102 | 2nd worst | 87.2% |
| chocolate mousse | chocolate cake | −0.098 | 4th worst | 90.0% |
| chocolate cake | chocolate mousse | −0.098 | 5th worst | 90.4% |
| pork chop | steak | −0.092 | not in worst 12 | — |